Stop Building Monitoring.Infrastructure Monitoring That Just Works.
You need monitoring, not a second full-time job. Bleemeo gives your team production-ready dashboards, alerts, and logs in minutes — no Prometheus expertise required, with controlled and predictable costs.
No credit card required • 15-day free trial • Production-ready in 5 minutes
Trusted by Growing Teams
From SaaS startups to mid-size businesses, engineering teams choose Bleemeo so they can ship features instead of maintaining monitoring infrastructure
What Our Customers Say
Engineers and CTOs trust Bleemeo to monitor their infrastructure
We need our teams focused on our core business — digital signage — rather than on infrastructure monitoring. Bleemeo monitors our entire environment, from bare metal to Azure, and frees our teams from useless alerts while guaranteeing our quality of service.

Bleemeo has supported us for years: simple, reliable monitoring that is essential to the quality of service we owe our customers.

On-premise or in the cloud, Bleemeo monitors my clients' Kubernetes clusters without any complexity. A tool I recommend for its simplicity and the clarity it brings.

Customer since day one, I'm thrilled with Bleemeo. It's easy to install, efficient, and just keeps getting better!

During a short lunch break we installed Bleemeo, created a custom metric, tested alerts, and were ready for production. The speed of deployment is remarkable.

Bleemeo support is simply legendary — fast, knowledgeable, and always there when we need it.

Bleemeo was incredibly fast to deploy. In about an hour we rolled it out across more than 100 servers and immediately gained full visibility into our infrastructure.

We set up monitoring for all our servers in just a few hours. The dashboard is clear, powerful, and genuinely enjoyable to use.

We deployed Bleemeo across our server infrastructure in only a few hours. Uptime monitoring now alerts us instantly whenever a service encounters an issue.

Fundamentals
Why Teams Switch to Bleemeo
Tired of maintaining Prometheus, Grafana, Alertmanager, and Thanos? We handle the entire monitoring stack — collection, storage, dashboards, alerting, and long-term retention — so your team can focus on shipping features instead of debugging observability pipelines.
Zero Configuration
Install one agent and everything is discovered automatically. No exporters to configure, no scrape targets to manage, no dashboards to build from scratch. Glouton detects services via TCP connection probes and adapts when your stack changes — no restart needed.
Predictable Pricing
Simple per-host pricing with no surprise bills. No charges per metric, per container, or per GB of logs. You always know what you'll pay — even as your infrastructure grows. Budget monitoring like any other fixed cost.
Works from Day One
Pre-built dashboards, default alert rules, and 13 months of retention included. Get real visibility in minutes, not weeks of setup. Every integration ships with curated dashboards and sensible alert thresholds so you can focus on resolving issues, not configuring tools.
No Infrastructure to Run
Forget about storage capacity, federation, high availability, and upgrades. We manage the platform — you just use it. No time series databases to tune, no retention policies to configure, no backup strategy to plan for your monitoring data.
Comparison
The Monitoring Landscape
Every growing team faces the same question: build your own monitoring stack, pay enterprise prices, or find a middle path. Here's how the three approaches compare when you factor in total cost of ownership — not just the license fee, but the engineering time to set up, maintain, and troubleshoot the monitoring system itself.
DIY Open Source
Prometheus + Grafana + Alertmanager + Thanos + ...- Weeks of initial setup and tuning
- Ongoing maintenance and upgrades
- Storage planning and capacity management
- High availability is your problem
- Full control over everything
- No recurring license cost
Great if you have a dedicated platform team with monitoring expertise. Most growing businesses don't have that luxury.
- Feature-rich and powerful
- Managed infrastructure
- Complex pricing with per-metric and per-GB charges
- Bills that grow faster than your infrastructure
- Steep learning curve to get value
- Often more tool than you need
Built for enterprises with big budgets, big teams, and the engineering bandwidth to manage complex observability platforms.
Bleemeo
Turnkey monitoring for growing teams- Production-ready in 5 minutes
- Simple per-host pricing, no hidden fees
- Auto-discovery of 100+ technologies
- 13 months retention included
- Prometheus & OpenTelemetry compatible
- European company, EU data residency
All the visibility you need, none of the overhead you don't. Monitoring that works on day one and scales with you.
Server monitoring
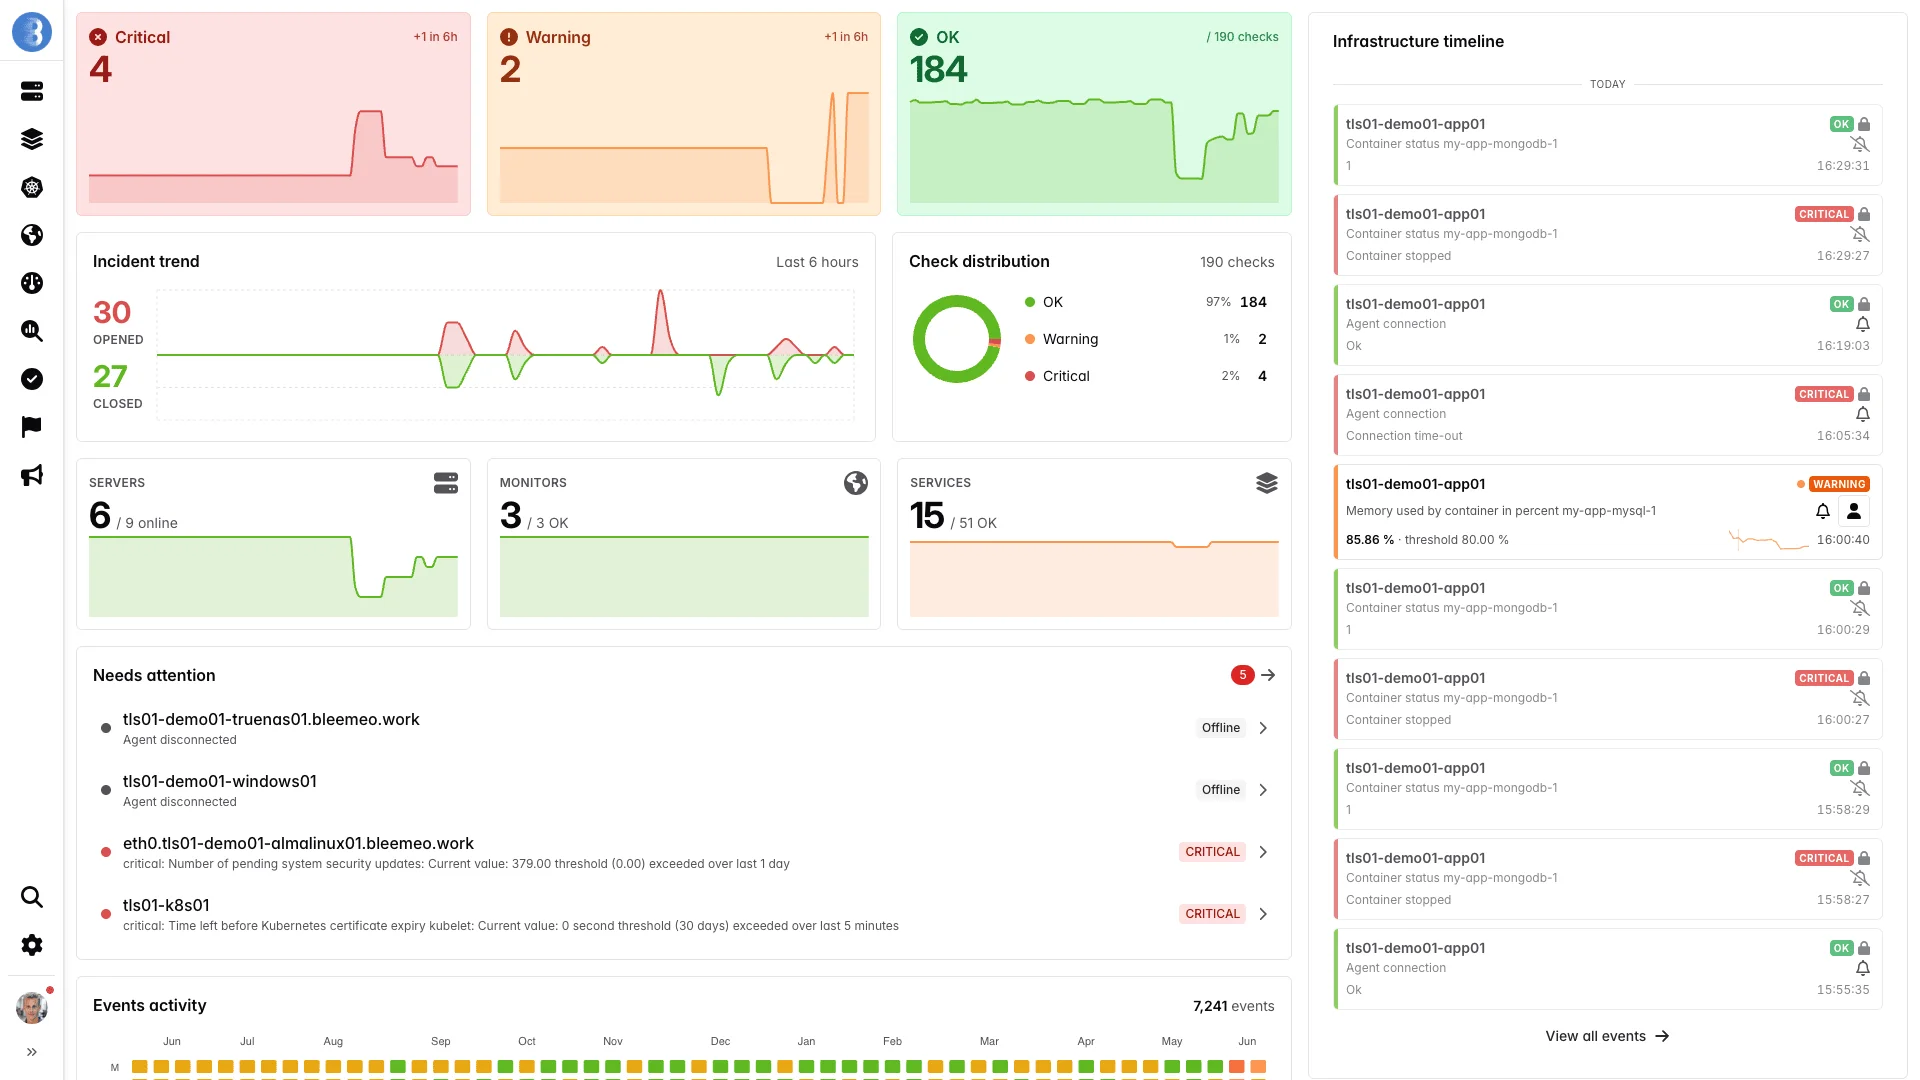
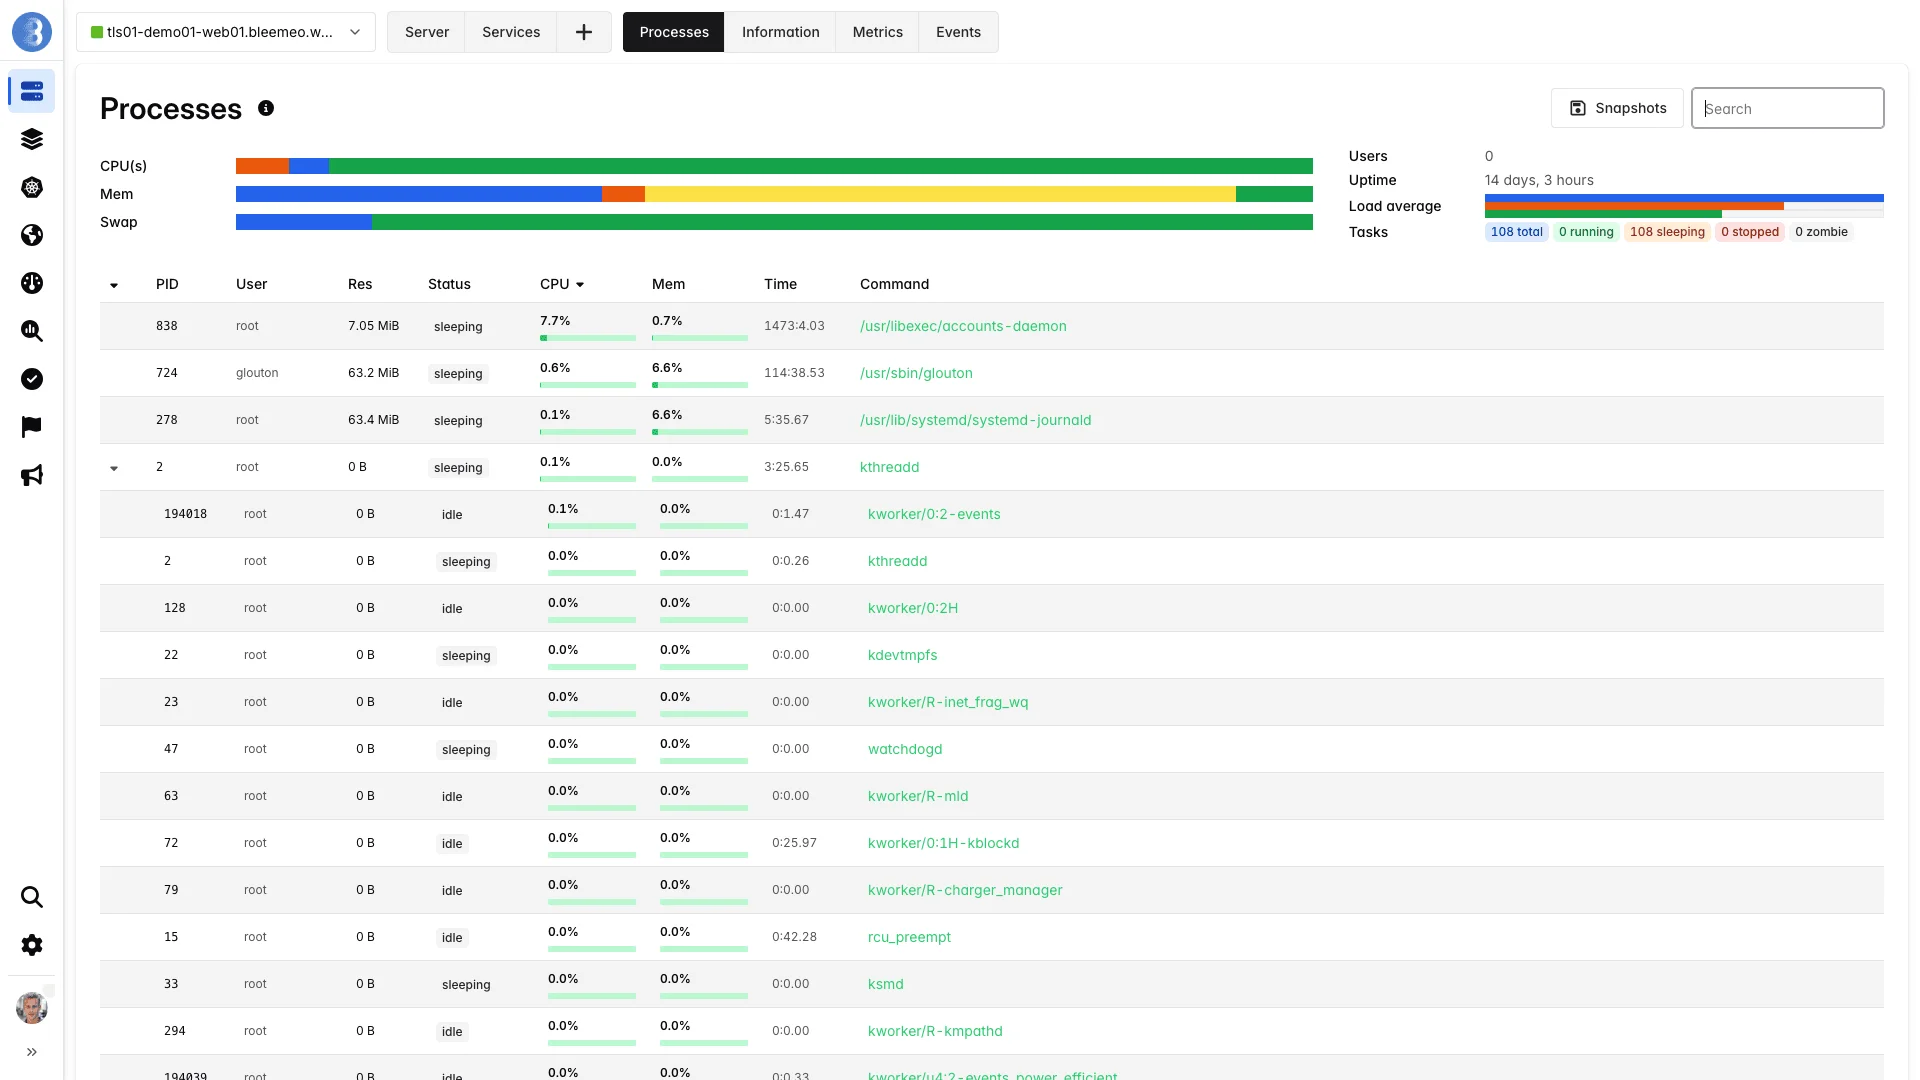
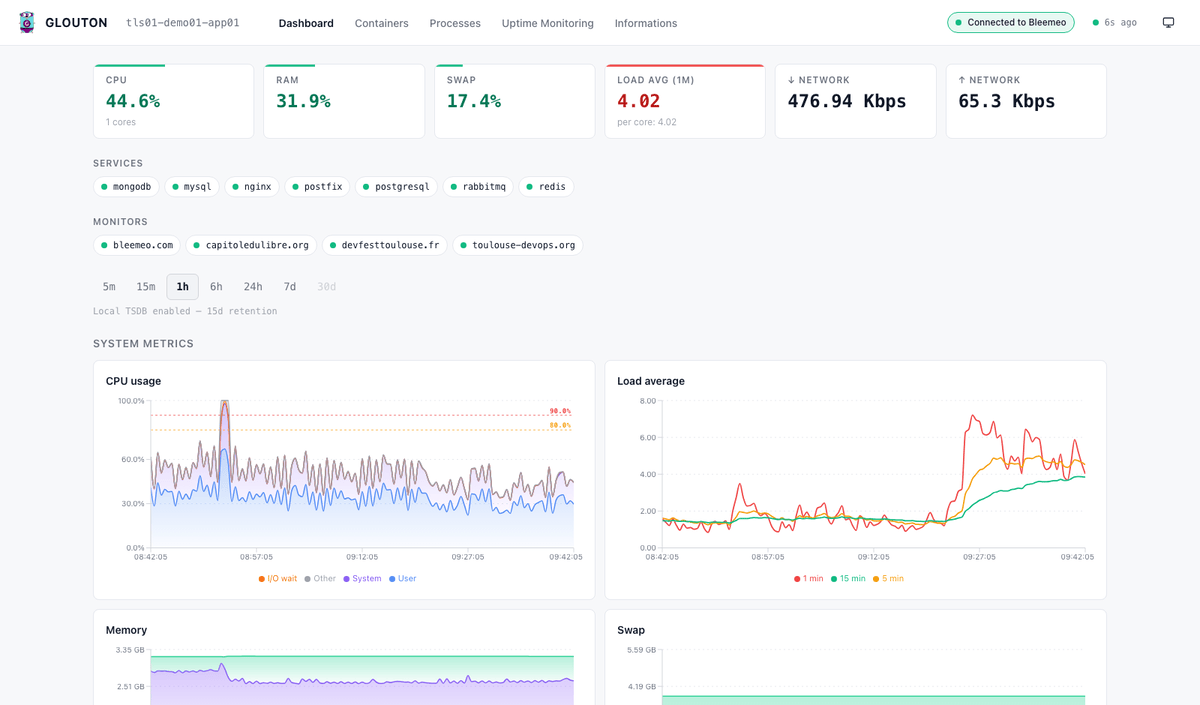
Server Monitoring That Sets Itself Up
Most monitoring tools require you to define what to monitor, write config files, and build dashboards before seeing a single metric. With Bleemeo, you install one lightweight agent and it does the rest.
Glouton, our open-source agent, automatically discovers every running service — databases, web servers, queues, containers — and starts collecting metrics at 10-second resolution. Dashboards and alerts are ready before you finish your coffee. The agent uses less than 1% CPU, under 100MB of memory, and installs with a single command on Linux, Windows, or via Helm on Kubernetes.
Coverage
One Platform for All Your Infrastructure Monitoring
Whether you run 5 servers or 500, Bleemeo adapts to your stack — not the other way around
Server Monitoring
Physical and virtual servers, VMs, and bare-metal infrastructure. CPU, memory, disk, and network metrics collected every 10 seconds with automatic service discovery and pre-built dashboards.
Explore server monitoring →Kubernetes Monitoring
Complete Kubernetes observability via Helm-deployed DaemonSet. Monitor clusters, nodes, pods, containers, and services with automatic discovery of ephemeral workloads and resource limits tracking.
Explore Kubernetes monitoring →Application Monitoring
Auto-discovered monitoring for MySQL, PostgreSQL, Redis, MongoDB, Nginx, Apache, RabbitMQ, Kafka, and 100+ other services. Track query performance, connection pools, and request latencies out of the box.
Discover application monitoring →Container Monitoring
Docker and containerd metrics out of the box. Track CPU, memory, and network per container. Automatic detection of new containers — no configuration changes needed when you scale up or redeploy.
Explore Docker container monitoring →Network Monitoring
SNMP-based monitoring for switches, routers, firewalls, and load balancers from Cisco, Ubiquiti, Dell, and more. Track bandwidth, error rates, and interface status with uptime checks from global probes.
Explore network monitoring →Cloud Monitoring
Native AWS CloudWatch integration for EC2, RDS, S3, Lambda, ELB, and more. Combine cloud service metrics with OS-level agent data for complete visibility across your cloud infrastructure.
Discover AWS monitoring →Log management
Log Management Built-In, Billed by Usage
With most monitoring vendors, logs are a separate product requiring separate infrastructure. With Bleemeo, log collection is built into the same agent you already run — no ELK stack to deploy, no Loki to configure. You only pay for what you ingest at 0.50€/GiB, with no hidden indexing fees or retention surcharges. Collect logs from files, containers, syslog, or via OTLP. Define pattern-based alerts to catch errors before your users do, and correlate log entries with metrics from the same time window for fast root cause analysis.
Prometheus
Love Prometheus? Skip the Ops Work.
Prometheus is powerful — but running it in production means managing storage, retention, federation, high availability, and a constellation of exporters. That's a full-time job you didn't sign up for.
Bleemeo gives you full PromQL compatibility backed by managed long-term storage with 13 months of retention. Keep the query language you know, drop the infrastructure burden. Our agent scrapes your existing Prometheus exporters locally and forwards metrics to the cloud — no Thanos federation, no Cortex cluster, no S3 buckets to size. You get the same PromQL queries you've always written, answered by a database that scales without your intervention.
scrape_configs:
  - job_name: 'nodes'
    static_configs:
      - targets:
        - 'node1:9100'
        - 'node2:9100'

  - job_name: 'kubernetes'
    kubernetes_sd_configs:
- role: podOpenTelemetry
OpenTelemetry and Prometheus Support, No Lock-In
Already using OpenTelemetry or Prometheus exporters? Bleemeo accepts your metrics and logs as-is. No proprietary agents, no vendor-specific SDKs. Your instrumentation stays portable — we just give it a home.
Send metrics and logs via OTLP (gRPC on port 4317, HTTP on port 4318) or let our agent scrape your existing Prometheus exporters. You can run both paths simultaneously — perfect for gradual migrations where you need continuity while switching platforms.
AI & ML
AI Monitoring That Reduces Alert Noise, Not Adds It
Small teams can't afford to chase false alarms. Bleemeo's AI learns your infrastructure's normal behavior and only alerts you when something genuinely needs attention — so you can sleep through the night. From anomaly detection that catches disk saturation trends weeks in advance to smart thresholds that adapt to your workload's daily rhythm, our machine learning works in the background to separate real incidents from routine fluctuations.
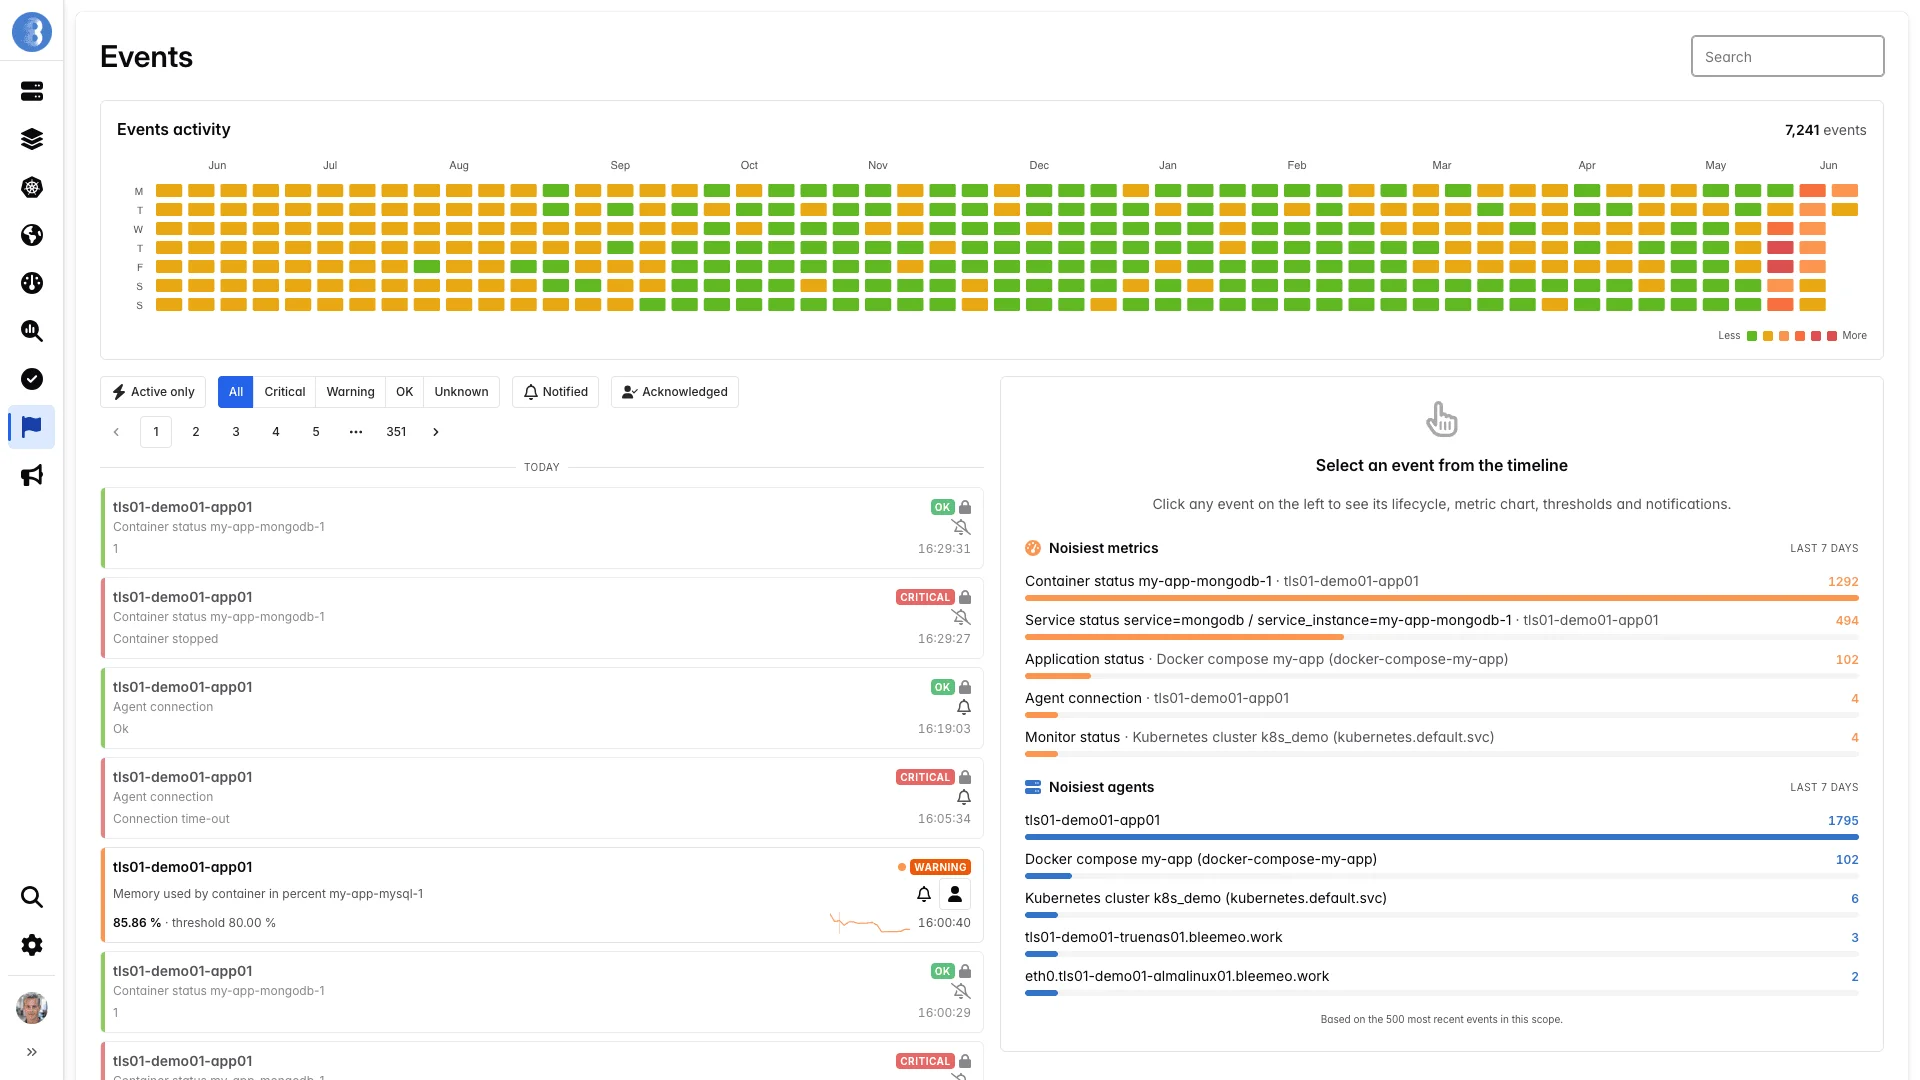
A year of events at a glance — patterns the AI uses to set adaptive thresholds.
Anomaly Detection
Machine learning identifies unusual patterns automatically, catching issues before they escalate into outages that affect your users.
Predictive Analysis
Forecast resource usage and capacity needs based on historical trends and seasonal patterns. Plan your next scaling event with data, not guesswork.
Smart Alerting
AI-powered alert thresholds adapt dynamically to your infrastructure's normal behavior, significantly reducing false positives and alert fatigue.
Root Cause Analysis
AI correlates events across your infrastructure to quickly identify the underlying cause of incidents. Spend less time investigating and more time fixing.
Capacity Forecasting
Plan infrastructure scaling with AI-driven predictions based on growth patterns and usage trends. Know months ahead when you'll need more capacity.
MCP Server Integration
Connect with Claude and other AI assistants through our Model Context Protocol server. Ask natural language questions about your infrastructure health and get actionable answers.
Security
Enterprise-Grade Security, Startup-Friendly Simplicity
Your monitoring data is sensitive — it reveals your infrastructure topology, performance patterns, and operational state. Bleemeo treats every byte of that data with the same care you would. Security isn't an add-on or an enterprise tier feature — it's built into every layer of the platform, from the agent running on your servers to the cloud storage where your metrics and logs are retained.
Every agent authenticates with the Bleemeo cloud using unique credentials tied to your account. There are no anonymous data streams and no shared endpoints — each metric source is verified before a single data point is accepted. This means you always know exactly what's reporting into your account, and nothing unauthorized can inject false data into your dashboards.
Data in Transit
All communication between agents and the Bleemeo cloud uses TLS 1.3 with certificate pinning. Metrics, logs, and control messages are encrypted end-to-end. No data ever travels in plain text — not even on your internal network if you use our OTLP endpoints. The agent communicates over MQTT and HTTPS, both secured with modern cipher suites that are regularly updated.
Data at Rest
All stored metrics and logs are encrypted using AES-256. Your data is logically isolated from other customers and hosted exclusively in European data centers. We retain metrics for 13 months and you can request deletion at any time under GDPR.
Authenticated Sources
Every Glouton agent registers with a unique account ID and registration key. OTLP endpoints require authentication tokens. Unauthorized sources are rejected immediately — your dashboards only show data from verified infrastructure. Combined with role-based access control, MFA support, and complete audit logging, you have full visibility into who accesses what.
Frequently Asked Questions
Everything you need to know about Bleemeo's monitoring platform
How does your monitoring platform work?
Bleemeo uses a lightweight open-source agent called Glouton that you install on your servers, VMs, or Kubernetes clusters. The agent automatically discovers running services and applications, collects system metrics every 10 seconds, and securely transmits data to our cloud platform. From there, you get real-time dashboards, intelligent alerting, and 13 months of metric retention. For cloud services, we integrate directly with AWS CloudWatch. The platform also accepts metrics and logs via OpenTelemetry (OTLP) protocol.
What types of infrastructure and applications do you support?
Bleemeo supports 100+ technologies out of the box with automatic discovery. This includes: Operating systems (Linux, Windows), Containers (Docker, containerd, Kubernetes), Databases (MySQL, PostgreSQL, MongoDB, Redis, Elasticsearch), Web servers (Apache, Nginx, HAProxy), Message queues (RabbitMQ, Kafka), Cloud platforms (AWS, Azure, GCP), and Network devices via SNMP (Cisco, Ubiquiti, Dell). We also support custom metrics through StatsD, Prometheus exporters, and OpenTelemetry instrumentation.
How do you integrate with my existing stack?
Bleemeo offers multiple integration paths: install our Glouton agent for infrastructure monitoring with zero configuration, send metrics and logs via OpenTelemetry (OTLP), or connect cloud accounts through native integrations. For notifications, we integrate with Slack, PagerDuty, OpsGenie, Microsoft Teams, email, SMS, and custom webhooks. No code changes are required for infrastructure monitoring - just install the agent and services are discovered automatically.
Does your monitoring impact system performance?
No. Glouton is extremely lightweight — typically under 1% CPU and less than 100MB of memory. The agent collects metrics asynchronously and batches transmission to minimize network overhead, so it never competes with your production workloads.
How do you ensure data security and privacy?
Security is fundamental to our platform: all data is encrypted in transit using TLS 1.3 and at rest using AES-256. We offer EU data residency for GDPR compliance. The agent only collects infrastructure metrics - never application data, passwords, or sensitive information. We implement role-based access control, audit logging, and secure agent communication with certificate pinning. Our infrastructure undergoes regular security audits and we maintain SOC 2 Type II compliance.
Do you support metrics and logs?
Yes, Bleemeo provides full observability for metrics and logs. Metrics are collected every 10 seconds with 13 months retention. Logs can be collected and centralized through our agent with real-time search, filtering, and alerting capabilities. Both data types can be correlated in our dashboards for comprehensive troubleshooting.
How quickly can I get started with your solution?
You can be up and running in under 5 minutes. Install our Glouton agent with a single command — one-liner for Linux, installer for Windows, or Helm chart for Kubernetes. The agent auto-discovers your services and populates dashboards immediately.
What makes your platform different from other monitoring tools?
Bleemeo stands out through: Simplicity - automatic discovery means no manual configuration of what to monitor. Open-source agent - Glouton is fully open-source, no black box. Predictable pricing - per-host pricing without hidden metric or data volume charges. Long retention - 13 months included, not 15 days. European company - EU data residency and GDPR-first approach. Standards-based - native Prometheus and OpenTelemetry support means no vendor lock-in.
Do you support OpenTelemetry and Prometheus?
Yes. Bleemeo natively supports both. For Prometheus, our agent scrapes existing exporters and PromQL works out of the box. For OpenTelemetry, send metrics and logs via OTLP (gRPC or HTTP) — no instrumentation changes required.
Is your solution suitable for cloud-native and hybrid environments?
Yes, Bleemeo is designed for modern infrastructure. For cloud-native: we support Kubernetes with full cluster, node, pod, and container visibility via Helm deployment. Auto-discovery handles ephemeral workloads automatically. For hybrid environments: monitor on-premises servers, cloud VMs, containers, and managed services from a single platform. Our agent works identically across environments, and dashboards can combine metrics from all sources for unified visibility.
Latest from Our Blog
Insights, tutorials, and best practices for infrastructure monitoring
Ready to Stop Building Monitoring?
Get production-ready infrastructure monitoring in 5 minutes. Focus on building your product, not managing your observability stack.
Start Free TrialNo credit card required • 15-day free trial • Full feature access